WorkVerdict anomaly diagnosis
EPOCH platform
Every anomaly gets a verdict. Or an honest silence.
Verdict is EPOCH’s own accelerator, demonstrated on public data and benchmarks. Math finds an anomaly’s likely cause inside Snowflake, a model only explains it and Verdict says so when it finds none.
- Built by
- EPOCH accelerator
- Industry
- Cross-industry
- Timeline
- Since May 2026
- Built with
- Snowflake, Snowflake Cortex, SQL
The problem
Every monitoring tool can tell you a number moved. Finding out why can cost a morning of slicing data, often past the moment to act.
Asking a language model looks like a shortcut. It is not. Published research shows language models do not reliably reason about time-series anomalies. A fluent wrong answer is worse than none.
So we built Verdict to diagnose with math inside Snowflake and use a model only for the words. Every result here comes from public data and benchmarks.
What we built
Verdict runs as six pluggable stages, from data adapter to evaluation. The answer is settled in code before any model is called.
- A detector scores every day against the whole series. A separate check watches for a total that collapses toward zero.
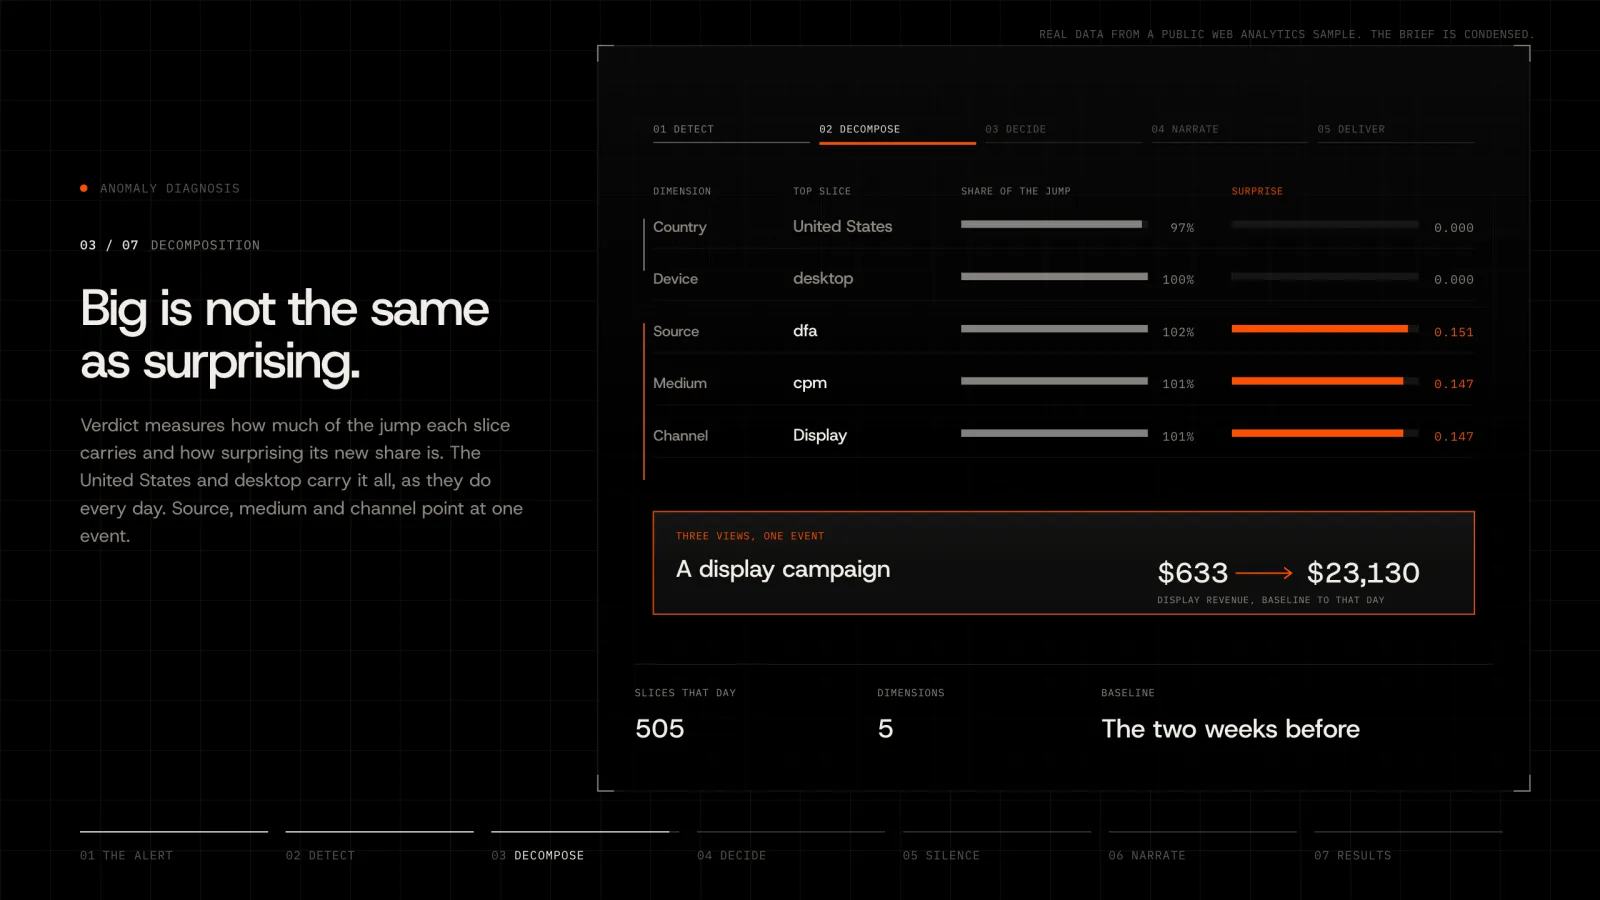
- Decomposition compares each slice with its own two-week baseline: how much of the change it carries and how surprising its new share is.
- Two deterministic checks route each case before any model runs. Did the total collapse? Is the change spread so evenly that no slice stands out?
- Snowflake Cortex gets a structured evidence package and an instruction to translate it, not to speculate. It writes one brief for each of five readers.
- Onboarding a dataset means writing one adapter. On day one, a profiler reads unseen data and recommends a method with a false-alarm risk estimate.
How we know it works
Follow one real spike. In a public web analytics sample, an online store’s revenue hit $27,151 on April 5, 2017, its highest day of the year and 466% above the two weeks before. That day sits 6.75 standard deviations above the mean, farther out than any other.
Across 505 slices, the United States carried 97% of the increase and desktop carried all of it. Both scored a surprise near zero, because that is where this store’s revenue lives every day. Source, medium and channel each jumped from $633 to $23,130 with nearly identical surprise scores: three views of one display campaign.
On August 3, 2016, the same revenue dropped to zero, a tracking outage. The collapse check caught it, the model was never called and the brief said the event looked system-wide.
- Predictions are registered before each experiment. The ones that fail stay in the record unedited.
- Every figure carries a 95% confidence interval. Every comparison between methods is a paired statistical test.
- Every published number traces to one manifest of 97 recorded runs across 10,300 labeled anomaly windows.
- For a client without labels, we inject known anomalies into its own data, so accuracy is measured before anyone is asked to trust it.
Results
- right cause ranked first on a public benchmark, against 14% by chance
- 86%
- right cause first on a simulated chemical plant, our open problem
- 8.7%
- labeled anomaly windows behind the measurements
- 10,300
- evaluation runs on record, the source of every published number
- 97
What changed
On a public industrial benchmark with 17 channels and 200 labeled anomalies, Verdict ranks the right channel first 86% of the time. A simple threshold detector gets 56%. Chance gets 14%.
On business metrics, scoring each slice against its own history roughly doubles the recall of a daily-total detector. At default sensitivity, the demo feed shows five signals: two with a cause and three honest silences.
Where it stops
- On a simulated chemical plant with 52 channels and 10,000 fault runs, the true cause ranks first only 8.7% of the time. It is our central open problem.
- A few channels flagged most of the time drown out the one that changed. One fix we expected to help made it worse. The next experiment is registered against it.
- On business metrics with injected anomalies, attribution names the right slice first 32.1% of the time, 41.5% at the event level. A daily-total detector catches only 22.6%.
- A feature that looked for leading signs days before an anomaly reached 31.2% accuracy against a predicted 60%. It ships switched off.
What we delivered
- Detection for wide sensor data and for dimensional business metrics
- Surprise-scored decomposition that separates the cause from where activity normally lives
- Deterministic routing between a narrated cause and an honest silence, before any model runs
- Narration through Snowflake Cortex, held to the evidence and written for five readers
- An evaluation suite with injected ground truth, registered predictions and paired tests
- A Streamlit app inside a client’s Snowflake account and a web workbench over a typed API
Technologies
- Snowflake
- Snowflake Cortex
- SQL
- Python
- FastAPI
- React
- Streamlit
More work
EPOCH platform
Predict the failure. Call the peak. Price the storm.
Grid Intelligence is the platform we built on Snowflake to answer the three questions that decide a cooperative’s year. Every model result was measured on a test fleet built from public utility data.
Read the story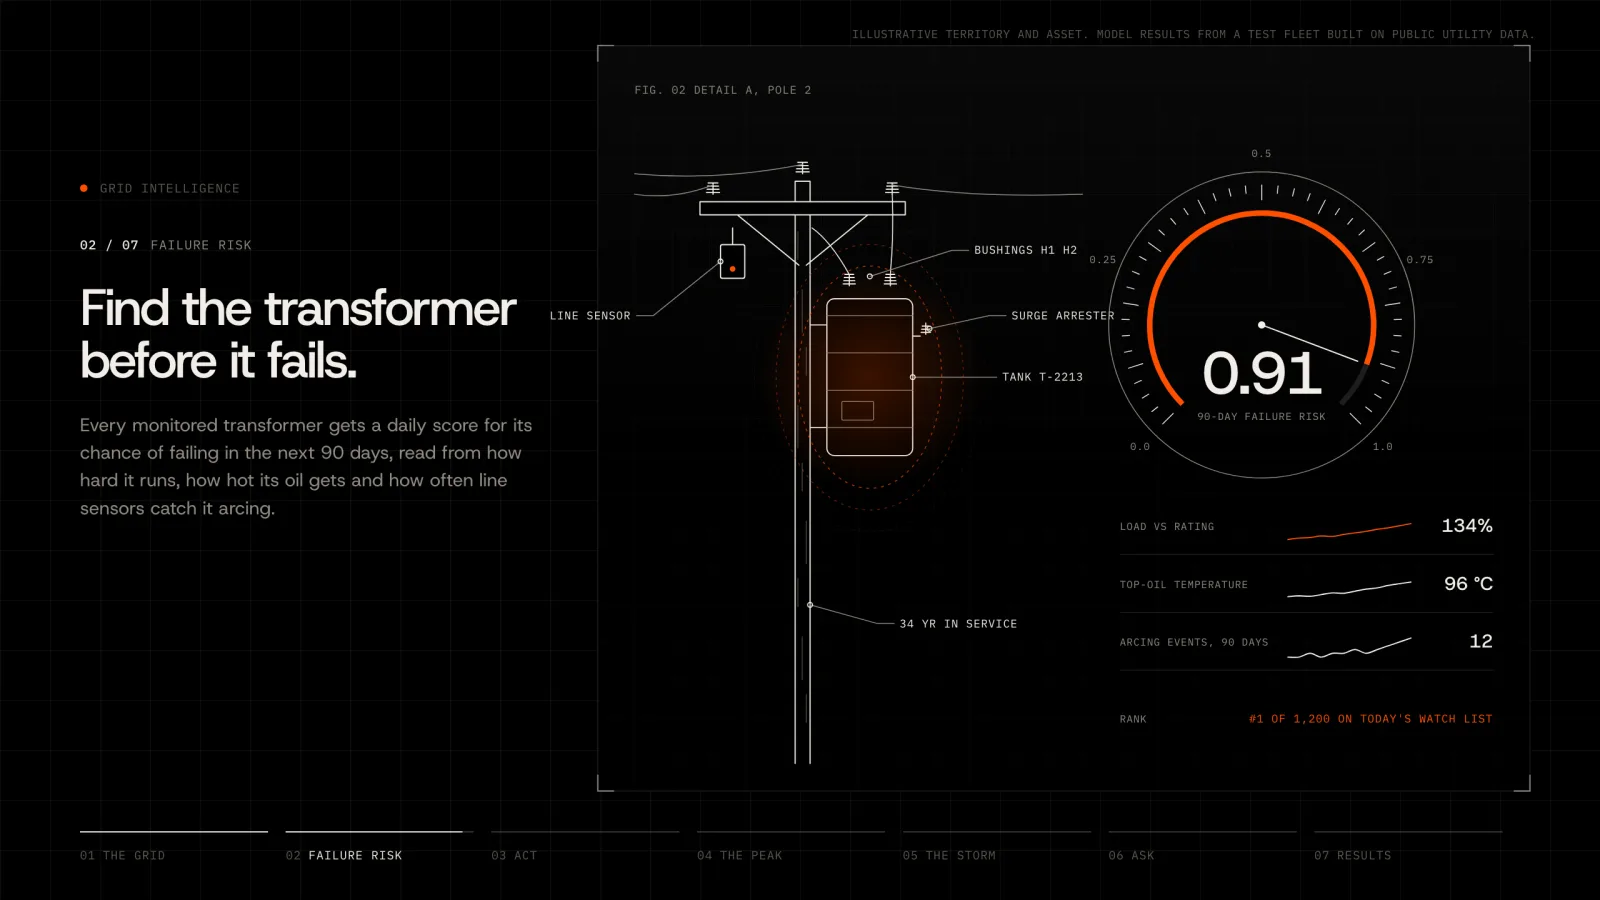 Grid Intelligence
Client work
Ready to buy, with the evidence to prove it
Buying signals hide across public and purchased data. We built AI agents on a deterministic spine that read 24 sources and hand Lenovo’s sellers the accounts ready to buy, why now and who to call.
Read the story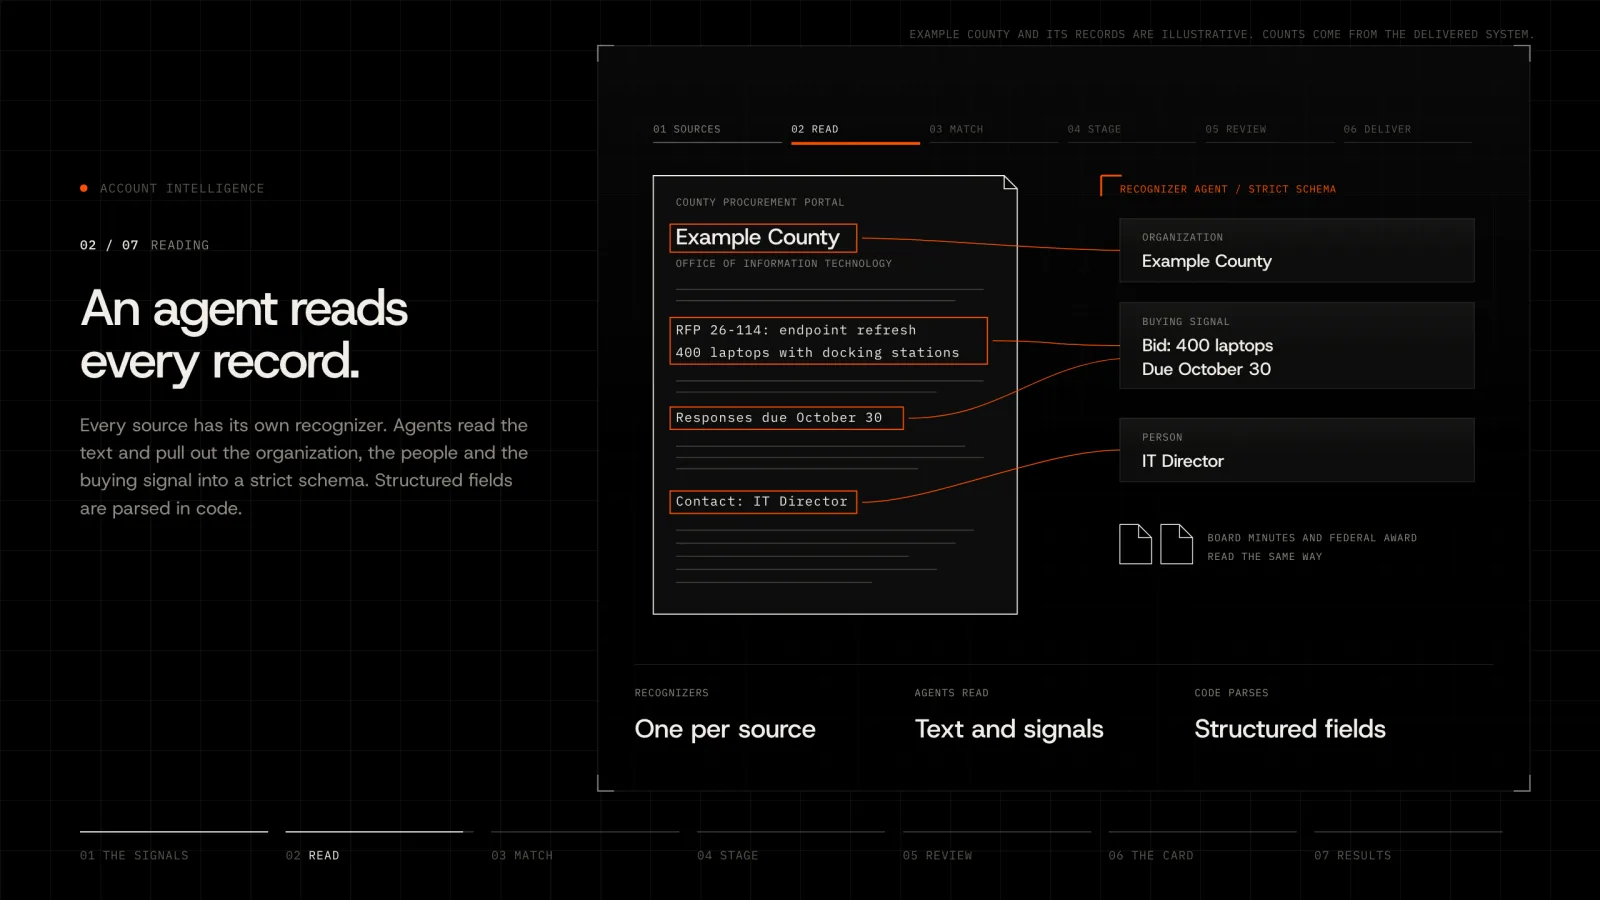

Bring us the project that matters most.
Tell us what you’re building and what’s in the way. You’ll hear back within 24 hours.